| Overview | All Modules | Tutorial | User's Guide | Programming Guide |
Module category: Tools
MakePlots generates a set of Unstructured_2D_Data objects, which may be plotted by Plot , out of some scalar fields.
MakePlots is available for all COVISE versions and supported platforms.
| Name | Type | Description |
| title | String | Title for the plot. |
| xAxis | String | X-axis label. |
| yAxis | String | Y-axis label. |
| auto | Boolean | If true, the module calculates some hopefully good values for the plot domain and for the axis ticks. If false, then you may set this values manually. |
| Xlimits | Float vector | Lower and upper limit of the X axis. |
| Ylimits | Float vector | Lower and upper limit of the Y axis. |
| Xticks | Integer vector | Number of major and minor X-ticks. |
| Yticks | Integer vector | Number of major and minor Y-ticks. |
| Name | Type | Description |
| requiredinPort_x | Float | X magnitude. |
| optionalinPort_y_0...
inPort_y_5 | Float | Y magnitudes. |
|
|
| Name | Type | Description |
| outputoutPlots | Unstructured_S2D_Data | The plots. |
|
|
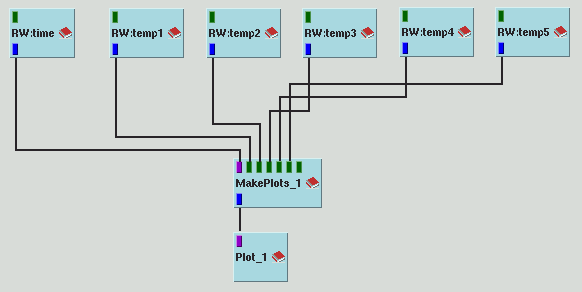
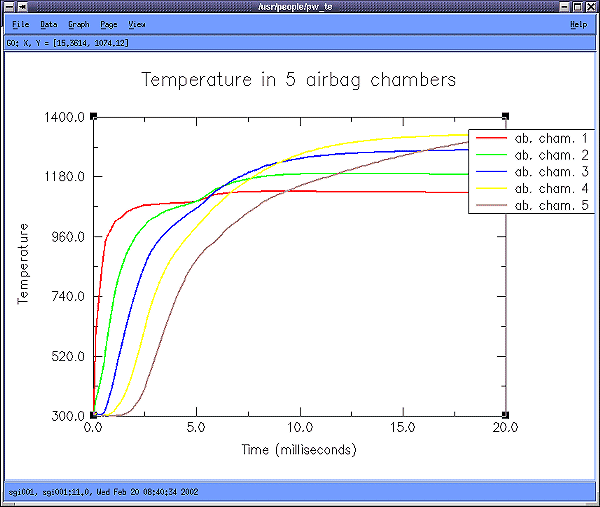
For examples you may take a look at both examples of ReadPAM . But lest you do not have a license for the DSY library, without which you will not be able to run these examples, we have used RWCovise in order to create six files for six scalar quantities used in the second of those examples. The first of this quantities is the real time for the time steps of a simulation, and the other five stand for the temperature in five chambers of an airbag. With these files we may create the map shown below using six RWCovise modules in the functionality of readers.
| Authors: Martin Aumüller, Ruth Lang, Daniela Rainer, Jürgen Schulze-Döbold, Andreas Werner, Peter Wolf, Uwe Wössner |
| Copyright © 1993-2022 HLRS, 2004-2014 RRZK, 2005-2014 Visenso |
COVISE Version 2021.12
|