| Overview | All Modules | Tutorial | User's Guide | Programming Guide |
Module category: Tools
The MinMax modules calculates the minimum and maximum value of a scalar data set. It outputs either a min-max pair that can be used for example as input for a colormap module, or a list of x-y pairs that shows the distribution of values over the range.
MinMax is available for COVISE version 3.1 and higher. It's tested on SGI systems (IRIX 6.2,6.3,6.4,6.5) and HP systems (HP-UX10.20).
| Name | Type | Description |
| NumBuck | Slider | number of steps for distribution of values |
|
|
| Name | Type | Description |
| requiredData | Float Float | scalar input field |
|
|
| Name | Type | Description |
| output2dplot | Unstructured_2D_Data | 2D array with a list of values (the step size depends on the NumBuck Parameter) and a list with the number of data points that are in the corresponding interval |
| outputminmax | MinMax_Data | Minimum and maximum value for usage in ColorMap module |
|
|
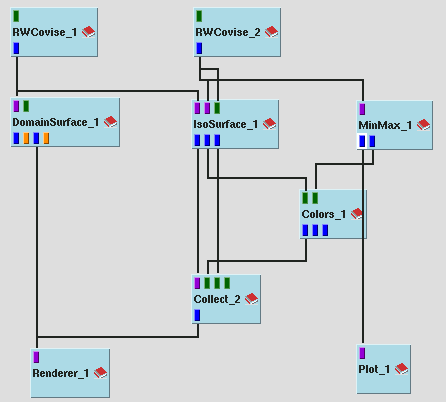
In this example the MinMax module is used to set the colormap for Colors module. Thus the color of the resulting isosurface is chosen according to the value in relation to the min and max value of the whole data set. If the MinMax module were not used, the color would always be the same, independent from the current iso value.
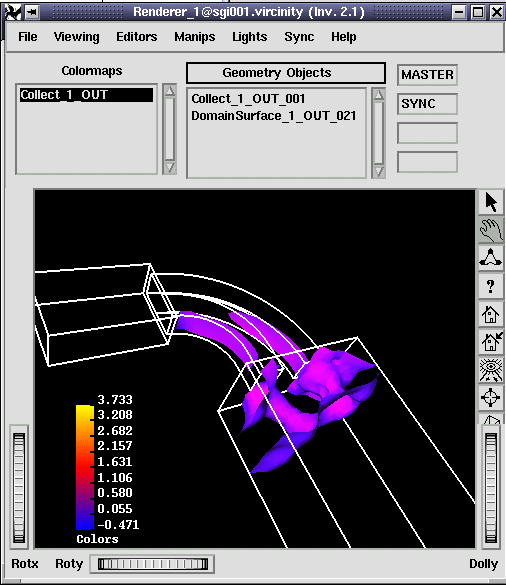
In the plot window the distribution of the data values over the whole range can be seen. The NumBuck value is 50, so 50 different bars will be displayed.

| Authors: Martin Aumüller, Ruth Lang, Daniela Rainer, Jürgen Schulze-Döbold, Andreas Werner, Peter Wolf, Uwe Wössner |
| Copyright © 1993-2022 HLRS, 2004-2014 RRZK, 2005-2014 Visenso |
COVISE Version 2021.12
|