| Overview | All Modules | Tutorial | User's Guide | Programming Guide |
Module category: Mapper
VectorField computes lines in a vector field.
VectorField is available for all COVISE versions on all supported platforms
| Name | Type | Description |
| length | Choice | With this parameter the length of the lines can be set.
1*scale scales all lines with the value of the scale parameter. length*scale means that the amount of the vector is used to compute the length which is then multiplied with scale. according_to_data scales the lines according to the data from the optional input port. |
| scale | Slider | Scale factor which is used when length is set to 1*scale or length*scale. |
| fasten | Choice | Point where the vector lines are fastened. Default is on_the_bottom which means, that the lines start at the grid/surface vertices. on_the_middle means that the middle of the line is fastened at the grid/surface vertices. |
| num_sectors | Scalar | arrow head is built using num_sectors lines - If you have difficulties in identifying the direction of the vector, you may introduce here a positive value in order to give all vectors an arrow point. This value parametrises the refinement of the graphical representation for the arrow points. In general values of an order of magnitude between 1 and 30 have to be enough for your purposes. |
| Name | Type | Description |
| requiredmeshIn | UnstructuredGrid RectilinearGrid UniformGrid Polygons Lines UnstructuredGrid TriangleStrips | The grid or surface on which vector data are available. |
| requiredvDataIn | Vec3 Vec3 Structured_V3D_Normals Unstructured_V3D_Normals | Vector data. The data have to be vertex based. In case you have cell based data (for example simulation results from StarCD) use CellToVert to convert them to vertex based data. |
| optionalsDataIn | Float Float | Optional Input Port. When the parameter length is set to according_to_data the scalar data are used to scale the vector lines. The scalar data have to be vertex based. |
|
|
| Name | Type | Description |
| outputlinesOut | Lines | Vector lines. |
| outputdataOut | Float | Scalar Data - no need for additional VectorScal |
|
|
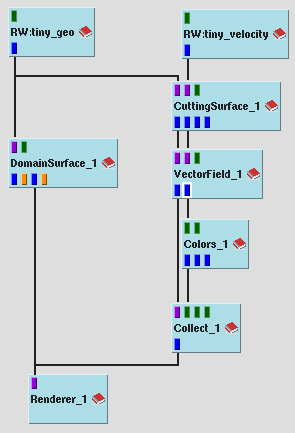
Example 1 is taken from the tutorial maps (tutorial_vel_4.net).
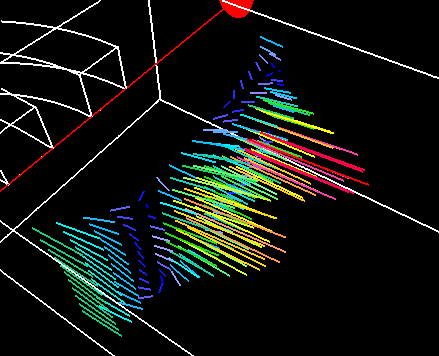
Displaying vector lines for each grid point point in a 3D volume often leads to very complex visualizations (see covise/net/tutorial/tutorial_vel_3.net). Therefore it is often clearer to display vector lines only on a surface, for example on the outer surface of the geometry or on a plane which cuts through the 3D data. In tutorial_vel_4.net the first RWCovise module reads in the computational grid of a channel with two inlets. The second RWCovise module reads in the velocity field. The module CuttingSurface extracts a plane with the velocity data on the plane. VectorField computes a vector arrow on each polygon vertex of the cutting surface. The module VectorScal computes the amount of the velocity and the module Colors computes colors from the velocity amount data. The colors and the vector lines are combined with the module Collect and displayed in the Renderer.
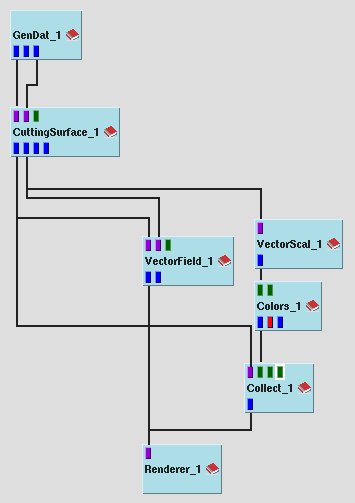
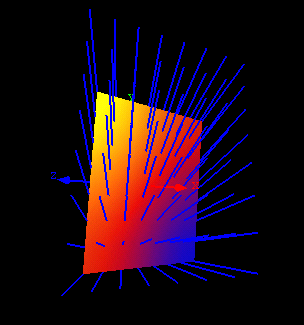
Example 2 is taken from the example maps (VectorField.net)
| Authors: Martin Aumüller, Ruth Lang, Daniela Rainer, Jürgen Schulze-Döbold, Andreas Werner, Peter Wolf, Uwe Wössner |
| Copyright © 1993-2022 HLRS, 2004-2014 RRZK, 2005-2014 Visenso |
COVISE Version 2021.12
|