| Overview | All Modules | Tutorial | User's Guide | Programming Guide |
Module category: Mapper
This module converts scalar input data into color values. It also produces Colormap output objects, which can be used as input objects to other Colors modules.
Colors is available since snap-2000-09 on all supported platforms.
| Name | Type | Description |
| Min/Max | Vector (Float[2]) | Minimum and maximum value of Map |
| annotation | String | The annotation is written below the color bar in the Renderer. If the field contains its default value "Colors" and an attribute "SPECIES" is found at the data value, the contents of the species variable are used instead. The Species attribute is automatically created by several readers, e.g. ReadStar |
| numSteps | Scalar (Integer) | Number of steps in the colormap. |
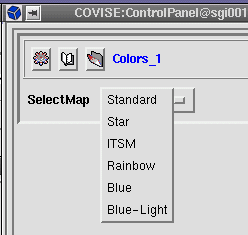
| SelectMap | Choice | The Colors module offers at least 4 built-in colormaps plus any number of maps specified in the covise.config set-up file. Select here which colormap to use. |
| autoScales | Boolean | Automatically adjust Min/Max fields according to data
values. Autoscaling will automatically be performed if minimum and maximum value are equal. |
| scaleNow | Boolean (PushButton) | When pressing this button, autoscale is de-activated, minimum and maximum are
set to 0.0 and the module executes. As the result, minimum and maximum value are
set and autoscale is off.
If scaleNow is used, the minimum and maximum setting of an incoming colormap are ignored, however, the next execution will again take the values from the colormap input. |
|
|
| Name | Type | Description |
| requiredData | Vec3 Vec3 IntArr Float Float | Data on a structured or unstructured grid or set of grid. |
| optionalcmapIn | ColorMap MinMax_Data | If this port is connected, and a colormap data object is received, it overrides all setttings of the module. If a pair of numbers indicating the minimum and maximum levels a the desired color map is received, this information is honoured by the output of the module (even if the user tries to use Autoscale). |
|
|
| Name | Type | Description |
| outputcolors | RGBA_Colors | Color Map. |
| outputtexture | Textures | Colors as a texture. |
| outputcmapOut | ColorMap | Colormap object: Contains all information of the colormap, including Min/Max, Annotation and numSteps. |
|
|
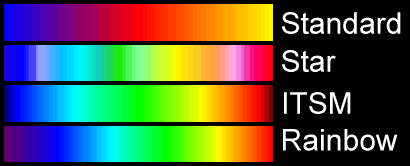
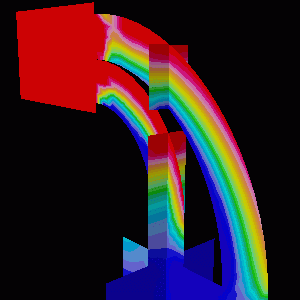
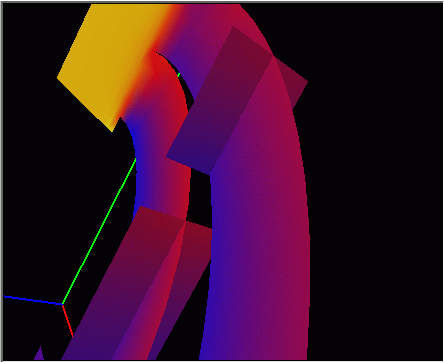
Predefined Colormaps are: Standard, Star, ITSM, Rainbow (see figure)
It is recommended to use a high number of steps for color-mapping, e.g. the default value of 256, and to use texture-mapping with lower numbers of colors.
User-specified Colormaps are not saved with the map: It is recommended to use the built-in colormaps
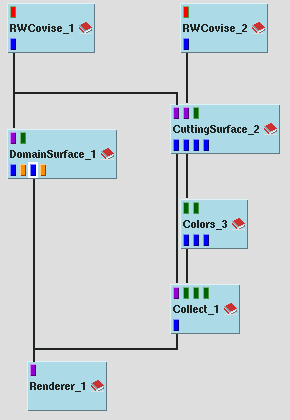
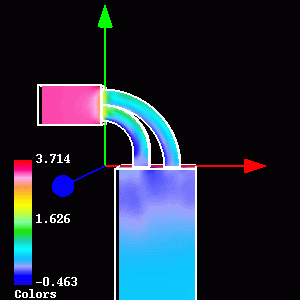
The map Colors1.net shows the usage of Colors as a Colormap module. The first output port of CuttingSurface delivers the surface polygons and the second the data on the polygon vertices. The data port is connected to the Colors module. The module computes a colormap and a texture which are available at the first and second output port. The third port contains a colormap object, which contains all information about the colormap used in the module. In this case the first output port is connected to the Collect module which means that the colormap is module. In this case the first output port is connected to the Collect module which means that the colormap is combined with the polygons into a geometry object. With the choice parameter SelectMap the Star (StarCD like) color map was selected.
The following snapshot shows the result in the renderer:
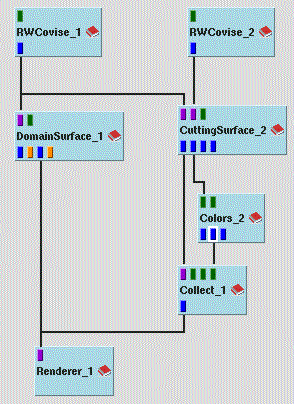
The map Colors2 shows the usage of Colors as a color texture module. In this case the second output port is connected to the fourth input port of the Collect module.
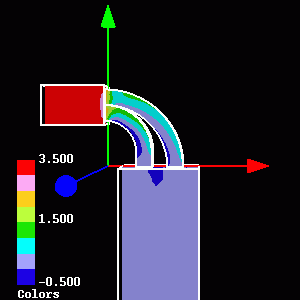
When using textures, the scalar data values are interpolated within the polygons and then the colors are mapped without interpolation from the color texture. This allows to extract numerical data from the visual output. Texturing is performed in hardware on high-end graphics workstations, however, if no texturing hardware is present, it will degrade performance significantly.
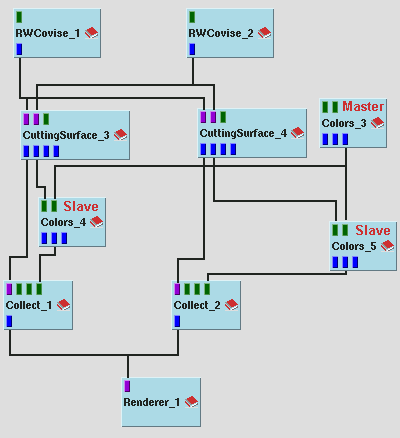
This map uses a single non-connected Colors module as a 'master' to control the parameters of all other Colors modules to assure that all cutting surfaces mapping the same species also use the same colormap.
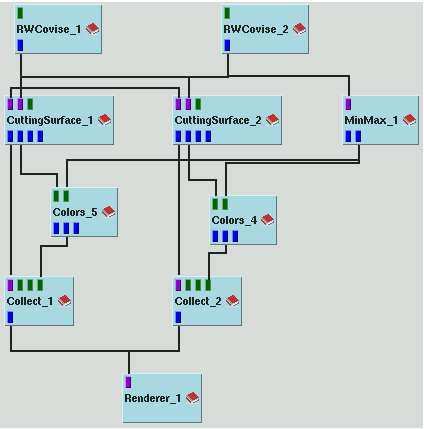
This map uses a MinMax module, which works out the minimum and maximum values of the scalar field in the whole volume. This result is made available to all Colors modules to assure that all cutting surfaces mapping the same species also use the same colormap.
Users can specify own colormaps in their covise.config file by specifying one section listing all available colormaps and one separate section for each map.
The names of all available colormaps are listed in the "Colormaps" section.
Colormaps
{
    Video
    Transparent
    ClipOut
}
This means that there are 3 user-defined Colormaps named "Video", "Transparent" and "ClipOut, which will be available after the four pre-defined Colormaps in the "SelectMap" choice of the parameter panel. For each of these, Colors looks for a definition section named Colormap_Name.
The easiest way to define a colormap is to give colors at aequidistant steps. The module then interpolates the selected number of steps between those given values. An example of this kind is:
Colormap_Video
{
    RGB   0.1 0.1 0.8
    RGB   0.1 0.5 0.5
    RGB   0.1 0.8 0.1
    RGB   0.5 0.5 0.1
    RGB   0.8 0.1 0.1
}
This colormap starts with a pastel blue over cyan, green, yellow to red, giving the red/green/blue components in the
interval [0...1].
It is also possible to specify transparency values (alpha). In the example above, the alpha value is automatically set to 100%, which means opaque. If a transparency value is given, it is added in the end:
Colormap_Transparent
{
    RGBA   0.0 0.0 0.0  0.0
    RGBA   0.0 0.0 0.7  0.9
    RGBA   0.0 0.7 0.0  1.0
    RGBA   0.7 0.0 0.0  0.9
    RGBA   0.0 0.0 0.0  0.0
}
The colors can also be specified on non-aequidistant positions, which are given before the color values in the interval [0...1] which is then mapped to [Min...Max]:
Colormap_ClipOut
{
    XRGBA 0.000  0.0 0.0 0.0  0.00
    XRGBA 0.001  0.4 0.0 0.4  1.00
    XRGBA 0.200  0.0 0.0 1.0  1.00
    XRGBA 0.400  0.0 1.0 1.0  1.00
    XRGBA 0.600  0.0 1.0 0.0  1.00
    XRGBA 0.800  1.0 1.0 0.0  1.00
    XRGBA 0.999  1.0 0.0 0.0  1.00
    XRGBA 1.000  0.0 0.0 0.0  0.00
}
This allows to "blind out" all values of a cutting surface above or below the interval [Min...Max] by making them transparent. Make sure the Renderer is set to a mode supporting transparency, e.g. "Sorted blended" in the Inventor Renderer. Alpha values are currently not supported for textures.
Non-aequidistant Maps without alpha can be given with "XRGB".
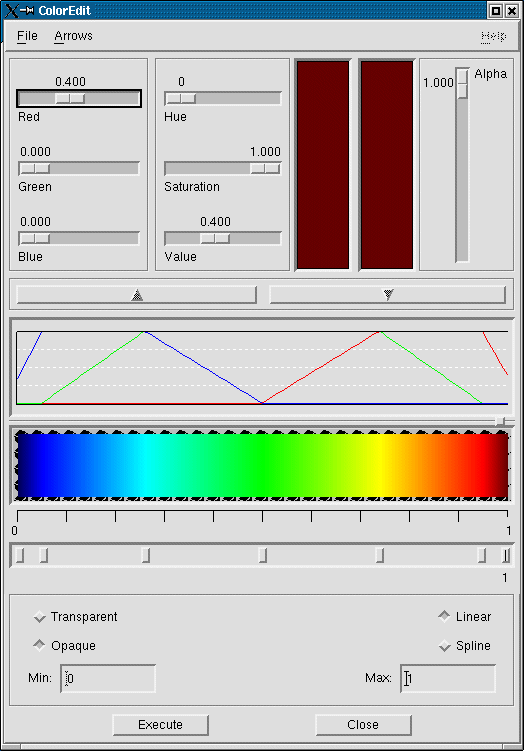
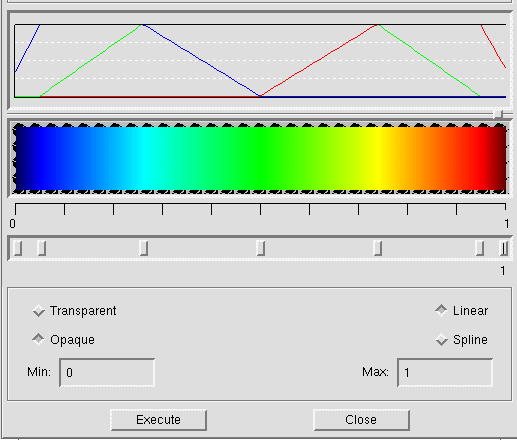
The colormap editor is a tool to create colormaps in a fast and comfortable way. The editor is started when the folder named UserColormap is opened. With this editor the "Standard" colormap can be edited.
A colormap is a function that assigns colors to scalar values. Colormaps can be saved to and read from files. The user can choose between two different interpolations - the linear and the spline one. The interval between the control points is filled by linear or cubic interpolation in RGB space.
To send the colormap parameter to the module and execute the module the "execute button" on the bottom of the window has to be pushed.
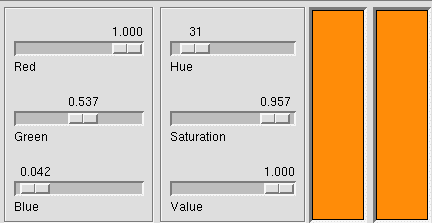
With the colorbrowser you can specify colors by dragging the RGB or HSV sliders. The current color is displayed in a small window. The minimum and maximum values for each component is 0 and 1. The maximum of the hue value is 360.
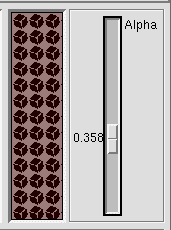
Opacity can be changed with an other slider. It is displayed in an extra window as the current color with the current opacity and a pattern as background shining through more or less. Alpha = 0 means totally opaque, alpha = 1 totally transparent.
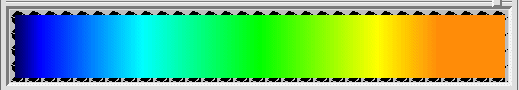
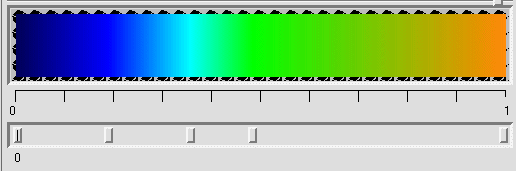
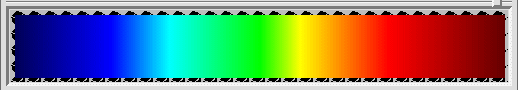
The palette window shows the current spectrum of colors. It can show the three color components or optional the color components plus the opacity. This window is a truecolor window that shows the colors in 16.7 million colors which gives a very good impression of the colormap and the opacity but will only work on work stations with such a visual.
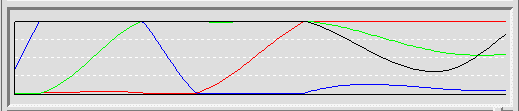
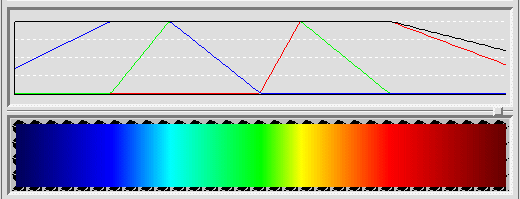
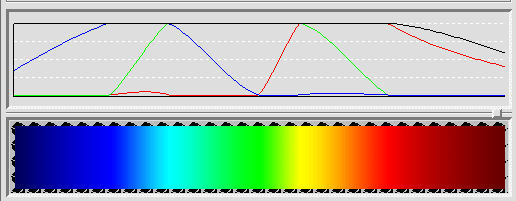
The function display shows the curves of the four components in a frame. The three color component curves of the RGB-model have the corresponding color and the opacity is a black curve. In this window the curves are only displayed and cannot be manipulated directly.
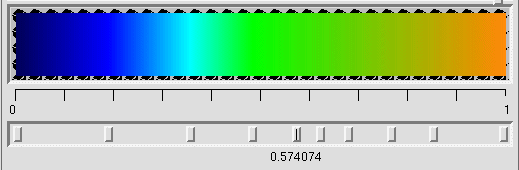
With the control point slider the positions of the different control points can be edited. By dragging the mouse with the left mouse button pressed you can move single points. Dragging with the right button squeezes the colormap; this means dragging the mouse to the right stretches the colormap left of the point and compresses it on the right side. Clicking on a slider with the middle button destroys it and clicking in an empty region of the slider creates one with exactly that color of the colormap. There is always one slider selected. You can recognize it by the black line on it. Sliders can be selected by clicking on them with the left or right mouse button. If a new slider is created it will be selected automatically. The color of the selected point is shown in the colorbrowser and can be edited there.
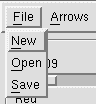
The leftmost entry in the menu bar contains all the operations to load and save a colormap.
"new" deletes the old colormap and creates a new default one shown in the following picture. The interpolation mode is set to linear. The borders are 0 and 1.
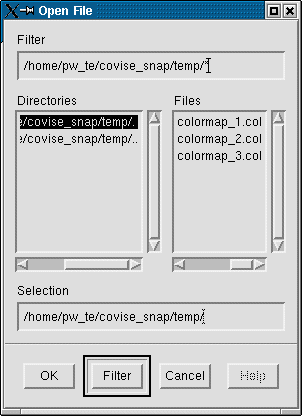
Selecting "open" pops up a file selector as shown in the figure.
After the colormap file on the right has been selected push the O.K. button to load it. The old colormap will be lost.
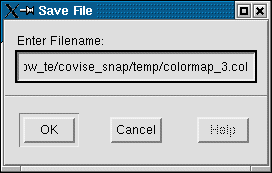
"save" pops up a dialog box to write the name of the current colormap for saving it.
"quit" exits the programm
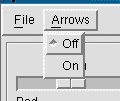
If the arrows are sensitive the colorbrowser and the current control point are unlinked. So if the user wants to copy the color of the colorbrowser to the current controlpoint the down arrow must be pushed and visa versa. The sensitivity of the arrows can be changed in the arrows menu of the menubar. If the arrows are set unsensitive the current control point is shown in the colorbrowser and will be updated automatically when changing the colorbrowsers color.
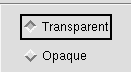
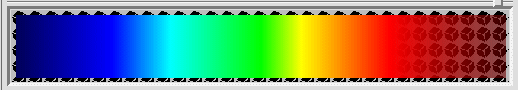
Here the user can switch the display mode of the palette window between the opaque and transparency mode. This does not change the colormap itself. In the opaque mode you only see the three color components. The transparency mode shows the background pattern shining through the colormap less or more. This display mode is slower.
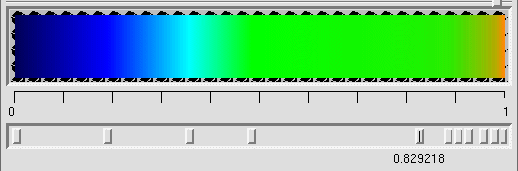
As shown in the figures the toggle changes the kind of interpolation used between the control points. Changing this mode is completely reversible.
| Authors: Martin Aumüller, Ruth Lang, Daniela Rainer, Jürgen Schulze-Döbold, Andreas Werner, Peter Wolf, Uwe Wössner |
| Copyright © 1993-2022 HLRS, 2004-2014 RRZK, 2005-2014 Visenso |
COVISE Version 2021.12
|