| Overview | All Modules | Tutorial | User's Guide | Programming Guide |
Module category: Interpolator
Interpolate creates a set of unstructured vector or scalar data by interpolation of the incoming data. For each point of the data set the intervall between zero and the current value is decomposed into a given number ns of segments. Two different interpolation characteristics are available:
linear:
Fi(x,y,z) = ns x F(x,y,z) / i (i = 1...ns)
sinusoidal:
Fi(x,y,z) = sin(ns x pi / 2i) x F(x,y,z) (i = 1...ns)
where Fi(x,y,z) is the value (or component) of the incoming field F(x,y,z) at any point (x,y,z), and ns is the number of interpolation steps.
| Name | Type | Description |
|
motion | choice | interpolation characteristics either linear or sinusoidal |
| type | choice | type of created (pseudo) time series. If linear is chosen the module creates ns steps ranging from the value 0 to the value of the incoming data at any point. The option cyclic creates the following sequence: 0 -> F(x,y,z) -> 0 -> -F(x,y,z) -> 0 NOTE: The option cyclic creates four times the chosen number of steps. |
|
steps | Slider | The number ns of interpolation steps per cycle. |
| abs | Boolean | This option is only effective if the option cyclic is chosen. The generated interpolation sequence is modified to: 0 -> F(x,y,z) -> 0 -> F(x,y,z) -> 0 |
|
|
| Name | Type | Description |
| requireddataIn_1 | Vec3 Float | Unstructured vector or scalar data to be interpolated. |
| optionaldataIn_2 | Vec3 Float | Additional Unstructured vector or scalar data to be interpolated according the parameters given. |
|
optionalindexIn | IntArr | Array of cell-types. |
|
|
| Name | Type | Description |
| outputdataOut_1 | Vec3 Float | Set of Unstructured vector or scalar data containing all interpolation steps generated out of dataIn_1. |
| outputdataOut_2 | Vec3 Float | Set of Unstructured vector or scalar data containing all interpolation steps generated out of dataIn_2. |
| dependindexOut | IntArr | Array of cell-types. |
|
|
The example pipelines shown in InterpolateScal.net and InterpolateVect.net show the generation of interpolated sequences for scalar and vector data.
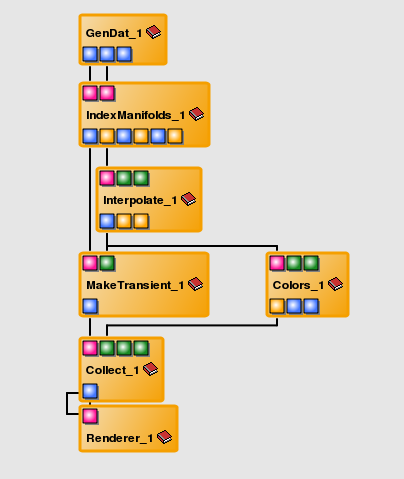
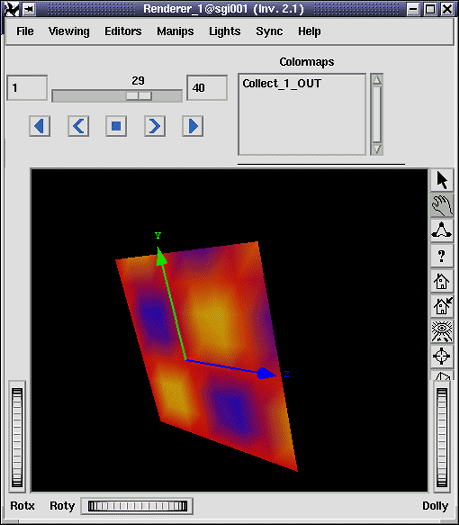
In the first case we prepare a cut through a simple scalar data field generated by the modules GenDat and IndexManifolds and then create an interpolated data sequence the corresponding grid the data lives on is generated by the module MakeTransient. In this case we have to assure that lengths of the sets created by MakeTransient and Interpolate are identical; to assure this, the first output of Interpolate is connected to the second (optional) input port of Make Transient. The corresponding output is shown in the first renderer image.
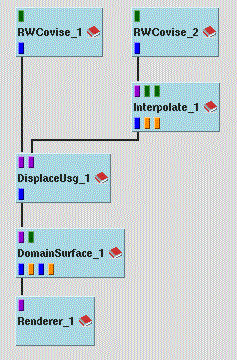
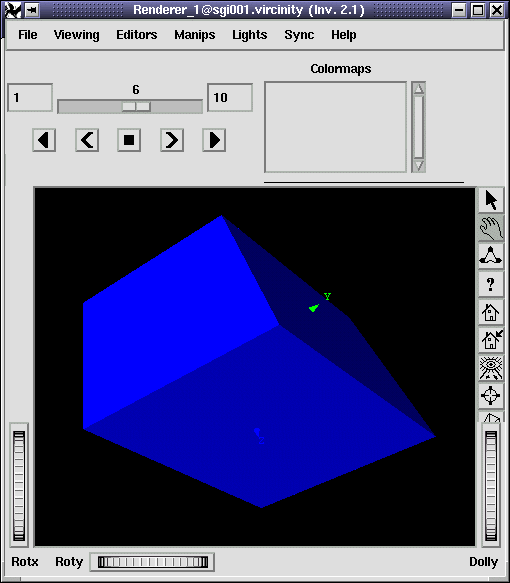
In our second example, vector data corresponding to a homogeneous shear deformation as well as a cubic region of an unstructured grid are read using the module RWCovise. Interpolate creates a time sequence of the vector data. Each generated vector field is then used by the module DisplaceUsg to deform the initial grid whose borders are displayed by DomainSurface. The corresponding output is shown in the second renderer image.
| Authors: Martin Aumüller, Ruth Lang, Daniela Rainer, Jürgen Schulze-Döbold, Andreas Werner, Peter Wolf, Uwe Wössner |
| Copyright © 1993-2022 HLRS, 2004-2014 RRZK, 2005-2014 Visenso |
COVISE Version 2021.12
|