| Overview | All Modules | Tutorial | User's Guide | Programming Guide |
Module category: IO
ReadNastran reads data written by MSC Nastran in binary output2 Version 70 format.
It currently supports the following subset of the NASTRAN data format:
| Data block | Data Cards |
| GEOM1S | CORD2C, CORD2R, CORD2S, GRID |
| GEOM2S | CBAR, CHEXA, CPENTA, CQUAD4, CTRIA3, PLOTEL, CONM2 |
| GEOM3S | FORCE, MOMENT, GRAV, TEMP |
| GEOM4S | RBAR, RBE2, SPC1 |
| OQG1 | - |
| OUGV1 | - |
| OEF1X | CQUAD4, CTRIA3, CBAR |
| OES1X | CQUAD4, CTRIA3 |
GEOM1S,GEOM2S, GEOM3S, GEOM4S : Problem Definition
OQG1, OUGV1, OEF1X, OES1X : Analysis Results
ReadNastran is available for COVISE version 4.5. It's tested on SGI and HP systems.
| Name | Type | Description |
| output2_path | File Browser | Nastran file (output2) location. |
| plotel_color | String | The color name to draw the PLOTEL elements. |
| conm2_color | String | The color name to draw the CONM2 elements. |
| conm2_scale | Scalar | The scale factor to draw the CONM2 elements. |
| force_color | String | The color name to draw the FORCE elements. |
| grav_color | String | The color name to draw the GRAV elements. |
| moment_color | String | The color name to draw the MOMENT elements. |
| rbar_color | String | The color name to draw the RBAR elements. |
| rbe2_color | String | The color name to draw the RBE2 elements. |
| spc1_color | String | The color name to draw the SPC1 elements. |
| spc1_scale | Scalar | The scale factor to draw the SPC1 elements. |
| mode | Scalar | If more than one mode was found in the analysis results (OUGV1 and OES1X), the mode number (starting from 1) can be selected here. |
| fibre_distance | Scalar | Fibre distance value to calculate the van Mises stress OES1. Must be either 1 or 2. |
| try_skipping | Boolean | - |
|
|
| Name | Type | Description |
| outputMESH | UnstructuredGrid | The geometry as an unstructured grid. |
| outputTYPE | IntArr | The element and property id's for a further selection through the module SelectUSG. |
| outputPLOTEL | Lines | PLOTEL is drawn as lines connecting the grid points. |
| outputCONM2 | Polygons | The location of the CONM2 card is drawn as small squares. |
| outputFORCE | Lines | FORCE is drawn as a line. |
| outputMOMENT | Lines | MOMENT is drawn as a line. |
| outputGRAV | Lines | GRAV is drawn as a line. |
| outputTEMP | Float | The temperature information of the nastran file. |
| outputRBAR | Lines | RBAR is drawn as lines connecting the grid points. |
| outputRBE2 | Lines | GRAV is drawn as lines connecting the grid points. |
| outputSPC1 | Lines |
The SPC1 card visualizes the degrees of freedom (DOFs)
at different grid points. The notation is as follows: A simple arrow indicates a possible translation along this axis. A double arrow indicates a possible rotation around this axis. A triple arrow indicates a possible translation and rotation. |
| outputOQG1 | Vec3 | The reaction forces (vectors). |
| outputOUGV1 | Vec3 | The displacements (vectors). |
| outputOEF1 | Vec3 | The element forces (vectors). |
| outputOES1 | Vec3 | Van Mises stress data. |
| try_skipping | Boolean | Some programs create non-standard NASTRAN files. If you get an error message while reading in the file try to turn this parameter on. |
|
|
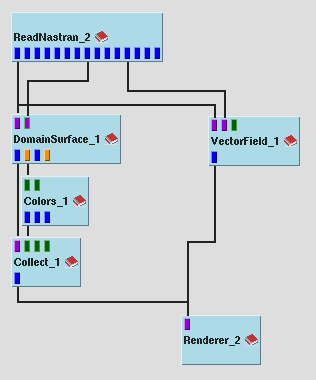
The example shows a simple map for displaying the geometry of an unstructured grid, generated from a NASTRAN structural analysis data sample. Additional temperature data is mapped through the Colors module path onto the geometry. The VectorField module maps the reaction forces OQG1 onto the geometry represented as white lines.
The next image is a snapshot of the results in the Inventor Renderer.

| Authors: Martin Aumüller, Ruth Lang, Daniela Rainer, Jürgen Schulze-Döbold, Andreas Werner, Peter Wolf, Uwe Wössner |
| Copyright © 1993-2022 HLRS, 2004-2014 RRZK, 2005-2014 Visenso |
COVISE Version 2021.12
|