| Overview | All Modules | Tutorial | User's Guide | Programming Guide |
Module category: IO
RWCoviseGroup reads or writes a group of COVISE files.
RWCoviseGroup is available for COVISE 5.1 and higher and on all supported platforms.
| Name | Type | Description |
| groupfile | Browser | Full filename of the group information file. Every line of this file must be in the format: <description>:<filename>. |
| file_0 ... file_15 | Choice | If these file choices are mapped into the control panel you are in the reading mode. With these choices you decide which output object every output port shall get. |
| description_0... description_15 | String | If you see the description fields in the control panel you are in the writing mode. NOTE: You have to execute the module once to get this object information! You can now give every object your own description line. |
|
|
| Name | Type | Description |
| optionalDataIn_0 ... DataIn_15 | UniformGrid
Text Points UnstructuredGrid RectilinearGrid StructuredGrid Float Vec3 Float Vec3 Polygons TriangleStrips Unstructured_V3D_Normals Geometry Lines PixelImage Texture IntArr RGBA_Colors | Input objects. |
|
|
| Name | Type | Description |
| outputDataOut_0 ... DataOut_15 | UniformGrid
Text Points UnstructuredGrid RectilinearGrid StructuredGrid Float Vec3 Float Vec3 Polygons TriangleStrips Unstructured_V3D_Normals Geometry Lines PixelImage Texture IntArr RGBA_Colors | Output objects. |
|
|
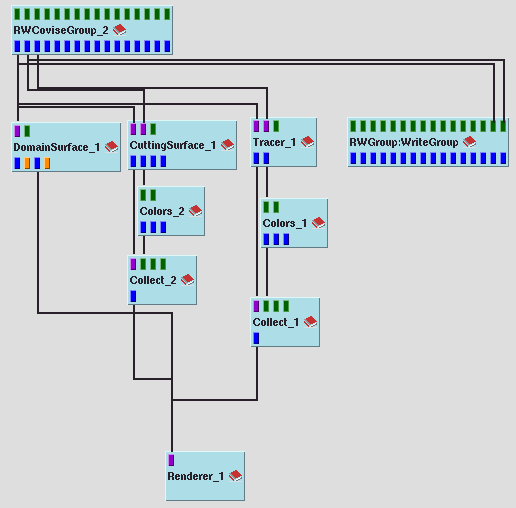
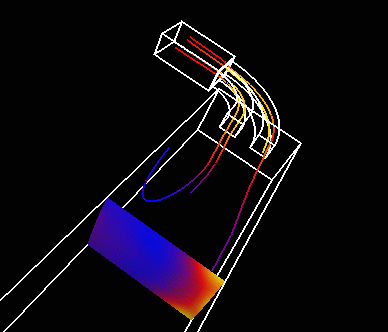
The first RWCoviseGroup reads the data in. We have four files: one for the grid data, one for the temperature data, one for the pressure data and one for the velocity data. The map uses the data to compute a cutting surface and some trace lines. In this example the temperature data is used for the cutting surface. But with RWCoviseGroup you can now visualize the pressure data without changing your map: Choose "pressure" for the field_1 choice parameter which defines the output of the second output port and execute the pipeline again. You then get the result shown in the next picture.
The second RWCoviseGroup modules is now in writing mode. You can choose your own description for the two connected ports.
| Authors: Martin Aumüller, Ruth Lang, Daniela Rainer, Jürgen Schulze-Döbold, Andreas Werner, Peter Wolf, Uwe Wössner |
| Copyright © 1993-2022 HLRS, 2004-2014 RRZK, 2005-2014 Visenso |
COVISE Version 2021.12
|