| Overview | All Modules | Tutorial | User's Guide | Programming Guide |
Module category: Filter
FilterCrop allows to reduce the number of grid lines in structured grids.
FilterCrop can either crop the index space of a grid by chosing min and max indices
different from 0 and the initial max value, by simply omitting all grid points
that lie outside this interval (this is independent for all three coordinate axes).
The other possibility is to use the sample parameter to skip a certain number
of intermediate grid points (this is the same value for all three directions).
A sample of 2 (the default) means that every second grid point will
be displayed, in the case of 3 every third grid point and so on.
FilterCrop is available for COVISE version 4.5 and higher. It's tested on all supported platforms.
| Name | Type | Description |
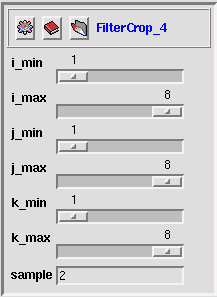
| i_min | Slider | minimum for the range of the i index |
| i_max | Slider | maximum for the range of the i index |
| j_min | Slider | minimum for the range of the j index |
| j_max | Slider | maximum for the range of the j index |
| k_min | Slider | minimum for the range of the k index |
| k_max | Slider | maximum for the range of the k index |
| sample | Scalar | reduces to every nth gridline |
|
|
| Name | Type | Description |
| requiredmeshin | UniformGrid StructuredGrid RectilinearGrid | Grids or sets of grids. |
| optionaldatain | Float Vec3 | Scalar or vector data on the grid or sets of scalar or vector data on the sets of grids. The number of elements must match the number of nodes in the grid. |
|
|
| Name | Type | Description |
| outputmeshout | UniformGrid StructuredGrid RectilinearGrid | The filtered and cropped grid. |
| dependdataout | Float Vec3 | The filtered and cropped data (this object is only created when the input port datain is connected). |
|
|
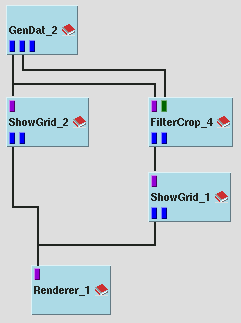
In this example some grid and data is generated by the GenDat module (it can be chosen whether this will be on a uniform, rectilinear or structured grid). After filtering and/or cropping the grid and the data the grid is displayed via the ShowGrid module in the Renderer. The next image is a snapshot of the Control Panel showing the parameters for the map FilterCrop.net.
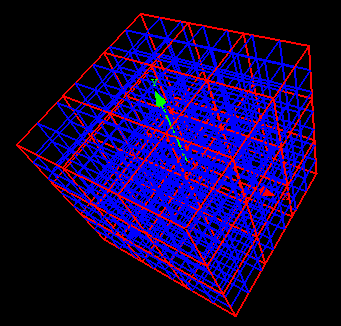
In addition the unfiltered grid can be seen in blue (partially overlapped by the white filtered grid). The next image is a snapshot of the results in the Inventor Renderer.
| Authors: Martin Aumüller, Ruth Lang, Daniela Rainer, Jürgen Schulze-Döbold, Andreas Werner, Peter Wolf, Uwe Wössner |
| Copyright © 1993-2022 HLRS, 2004-2014 RRZK, 2005-2014 Visenso |
COVISE Version 2021.12
|