This chapter explains the usage of the COVISE Map Editor, how to work with modules, connect module ports to a map and modify module parameters. After reading this chapter you should be able to visualize your data within COVISE.
The graphical user interface is based on the Qt software
from Trolltech . After typing covise on a command line or clicking on a covise icon the
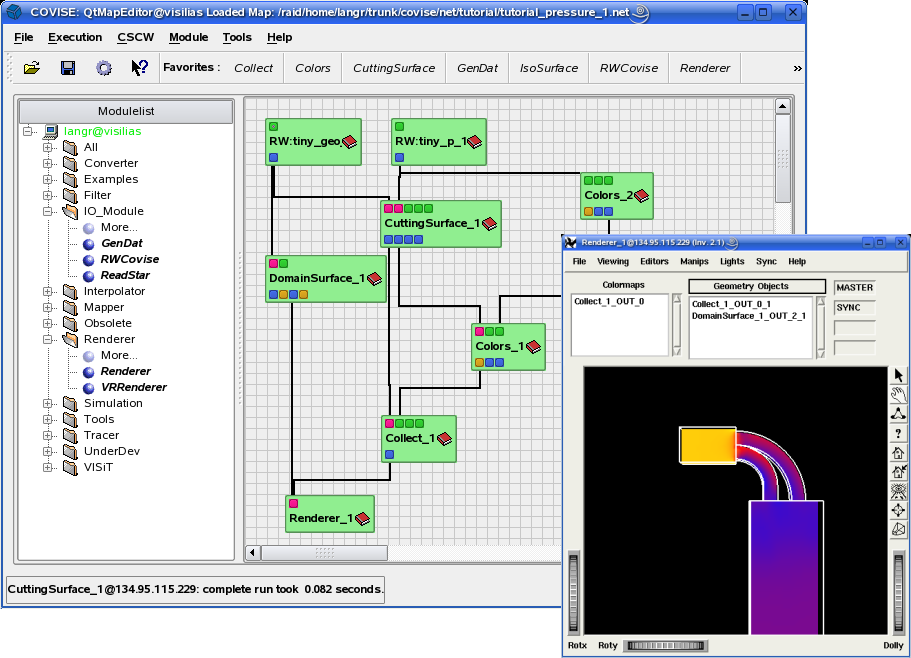
Map Editor top level window appears.
The windows layout consists of the following main parts:
The Menubar contains all items to
Most of the items in the File entry of the Menubar are also avaible in the Toolbar:
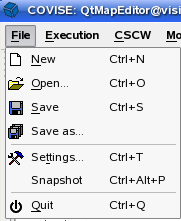
allows you to generate new module networks from scratch. The whole canvas will be cleared, also the parameters in the Control Panel and all data objects are destroyed. Added hosts will remain in the session.
enables COVISE to load a previously stored module network including the stored parameter settings. The current layout in the canvas is destroyed as if New would have been chosen. If modules are distributed and the used hosts have not yet been included in the session, the passwords for the participating hosts are required.
The loaded network appears in the Visual Programming Area. Each module is represented by an icon. A Module Icon consists of input data ports on the top, output data ports on the bottom, a label and a book icon.
stores the current network and its parameters. This is possible at any time, even while working in collaborative mode. If a previously opened module network exists the same filename and path is used for storing. Otherwise a file browser is opened.
stores the current map and its parameters. A prompt appears asking for a storing location.
defines the layout and behaviour of the Map Editor. The parameters are described in Settings.
resets the default layout.
copies the content of the Visual Programming Area into a png file. If a network is open or has been previously saved the current network is stored using this filename and path. Otherwise the current working directory is used.
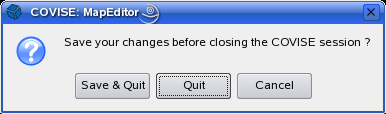
pops up an logout window when something was modified.
When Yes is selected the COVISE session is closed. All participating processes on all attending
hosts are also terminated.
When executing a module network one module icon after the other shows a colored frame which indicated that it operates. A module network can be executed once or repeatedly.
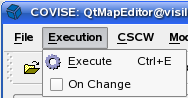
The settings are:
the complete module network independent of the previous state. Stored parameter changes are applied. This item is also avaible in the Toolbar.
Executing the module network beginning with a certain module is described in the Module Actions, Module Parameter and Control Panel.
behaves as an update. It initiates an execution after every single parameter change. The Control Panel interactor Player and Sequencer in play or reverse mode (not in single step) will automatically set OnChange and start the execution of the map repeatedly until their ending condition is met. You can also set OnChange explicitly within the Control Panel.
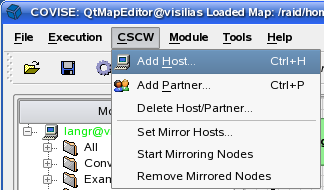
This menu entry contains items for a distributed or collaborative working mode
Additional hosts can be introduced at nearly every time during a COVISE session. It serves to use specific resources like supercomputers or fileservers. The first three items of this menu entry are also available in the Toolbar.
A master/slave relationship is applied among participating partners of a session. This means, that at every point in time only one participant has control over the overall session, while the others can only watch ongoing actions performed by the master. All slave windows are insensitive for user input that influence the network consistency and parameters. Important events are spread to all slaves. Therefore when a new network is generated or edited, every module icon and connection line between module ports also appears on the slave Map Editor canvas. The modifications in the Module Parameter and attached parameters in the Control Panel are also spread to the slave sides.
Clicking on the RequestMasterState item pops up an inquiry dialog on the master side, informing that a user on a slave host wants to become the master.
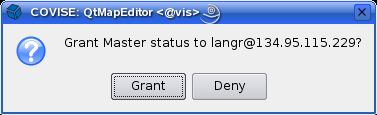
If the master rejects the action the requesting slave will be informed.
Otherwise the master/slave relationship between these two will be exchanged. As a result the greyed menus of the MapEditor on the previously slave side are now in black, while all menu items on the previous master side except for the MasterRequest and the Help button are now in grey.
This item adds another host to the current session. No other Map Editor or COVISE session will be started at that host. Only modules can be executed on this host.
This item will invite a partner to participate in a current session. A complete COVISE session starts on that host. The partner gets an own Map Editor. The content of the local windows are duplicated to those windows. By default the invited partner is in a slave state, so he can't initiate actions, until the master/slave relationship is changed via the item Request Master State . All important events are spread to all slave user interfaces and all parameters and user actions are copied. The only enabled button in the Menubar of the partner is the RequestMasterState and the Help button.
A host in the Module Browser can be deleted by clicking on it with the right mouse button. This action is not possible for the first host of a COVISE session.
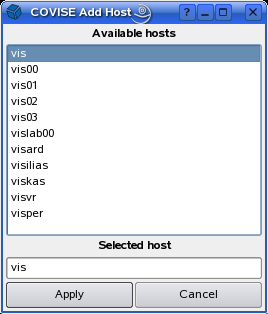
Pressing AddHost or AddPartner will pop up the left
window . Compare the below figure. In this window
a existing can be selected or typed. The hostnames in the list are the same as in the
scope HostConfig of the COVISE configuration file. When OK is pressed
COVISE will look for information about the requested host.
This is shown in the right window.
The default values for the remote host are also taken from the scope HostConfig of the configuration file.
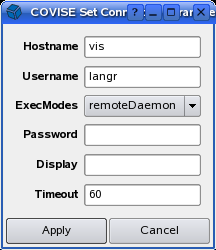
The timeout value specifies how many seconds a process will wait to be contacted by a new process it initiated (e.g the Controller waiting for module). This parameter should be increased if the network is slow.
The execeution mode specifies the command which should be used to start the CRB on the remote computer. Possible execution modes are:
An userid and a password for the remote machine has to be typed. This is similar to login on a remote computer via telnet.
In this case only the userid is required. A password on the remote machine is not needed. The rsh specific rules for remote execution pf proceses have to be followed.
Same as above, but a secure shell is needed.
This is not recommended. It can be used to put the CRB into a batch queue.
Manual means that someone has to start the CRB process manually on the remote machine.
This can be useful for sessions across firewalls or access to the remote account is not available.
In this mode COVISE writes a message in the window
start "crb 31005 129.69.29.12 1005" on visper.hlrs.de .
The collaborativg partner has to type in this quoted string.
A remote COVISE daemon has to run on the other machine. Currently this is only avalaible for Windows.
When the remote host is successfully added, the remote username and hostname will appear in the ist of hostnames of the Module Browser with a different color.
Module icons in the Visual Programming Area can be manipulated.
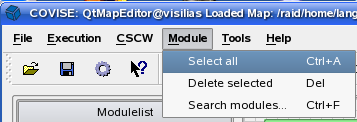
The settings are:
All modules in the canvas are selected. Further operations can be applied on this group.
Delete currently selected modules.
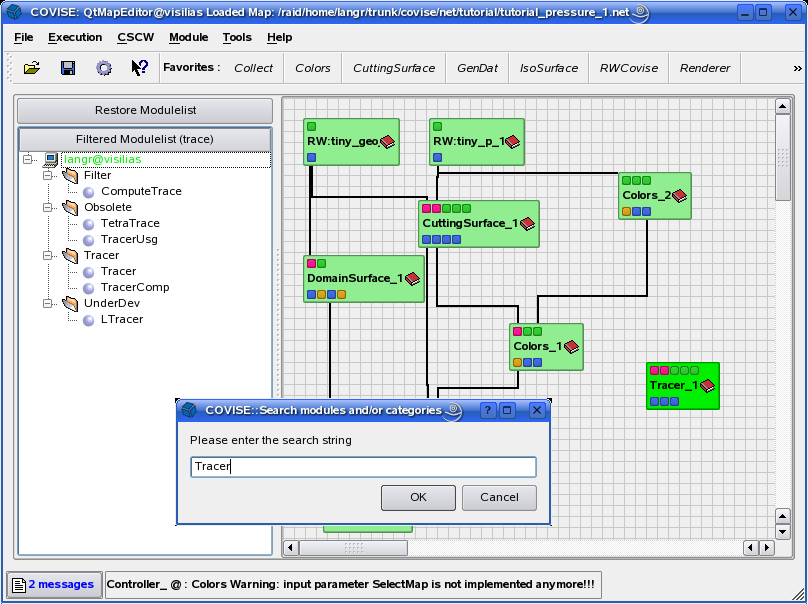
This entry opens a window which allows to enter a search string. All categories and/or modules containing this string in the name will be highlighted. Icons of these module in the Visual Programming Area will also be highlighted.
The items of this menu entry open additional window parts.
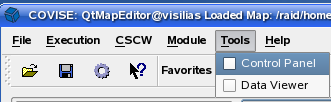
The settings are:
Enables/disables an additional window on the right side.
Control Panel shows more information.
Opens an additonal window containing the COVISE Data Viewer .
A tooltip is a small piece of text that appears when the cursor is hover a widget for a certain period of time. Tooltips are available for all icons of the Toolbar, the main buttons in the Module Parameter window, the Control Panel, the Settings and some other relevant items.
If more information is needed about a certain region of the Map Editor the "What's This ?" mode is ideal. The mode can be entered when the ? icon in the Toolbar is clicked. The cursor changes to *** . Click a region to obtain more information.
COVISE opens a seperate help window when the item "Help" in the menubar is pressed.
This window is also available with Shift+F1.
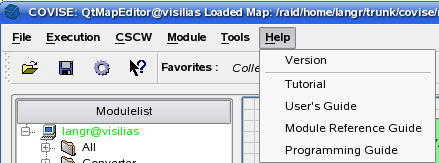
The following help topics are available.
The Toolbar contains
![]() or
or ![]()
These icons have the same behaviour as the items in the Menubar. The toolbar is dockable that means it can be disconnect from the main window and show the content in an own separate window. A short decription of the icons is given in the following list:
Favourites are often used modules. They can be used in the same manner as modules listed in the Module Browser.
![]()
This area contains a hierarchy (tree) displaying the hostnames, category names and module names. When COVISE is started in single user mode only the name of the local host is shown in the tree.
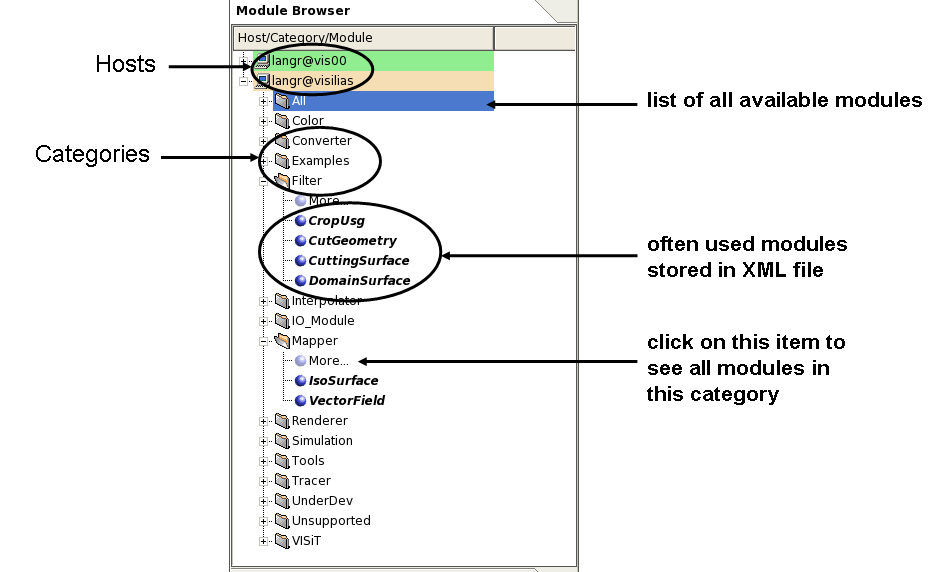
Modules running on a host appear in the same color as the host name in the list. The
subdirectories of ~/covise/ARCHSUFFIX/bin will be used as names of the categories. The files
in each category subdirectory are displayed as module names.
Short description of the category and the modules are shown as tooltips. Clicking on a host with the right mouse button opens a popup menu with one single entry Delete Host. Clicking on this item with the left mouse button will remove all modules running on that host and a possible remote user interface. Clicking on a category or module with the right mouse button will open the COVISE help system.
The modules shown for each category depend on the choosen modules in former sessions. To simplify the view only modules which have been used before are shown. All other modules are hidden behind the item More... Clicking on this item will show all available modules in this category.
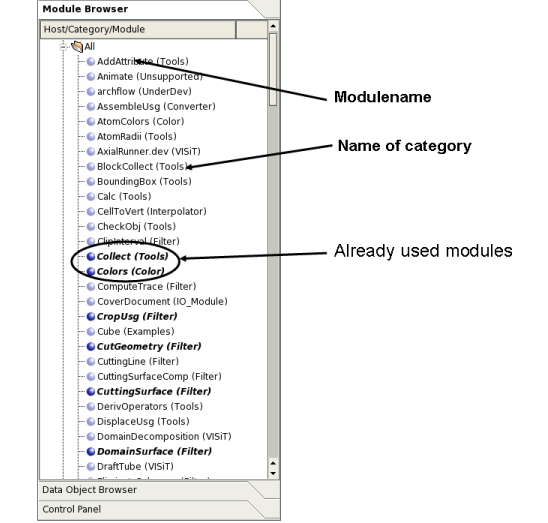
The special category All contains all available modules in alphabetic order and the corresponding category.
Interacting with the Module Browser is done in the following ways:
To start a module its module name has to be dragged to the canvas. A Module Icon on the canvas indicates, that the respective program representing the module has been started and waits for its execution.
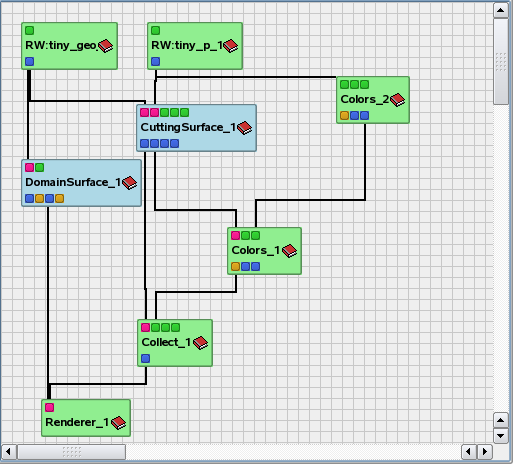
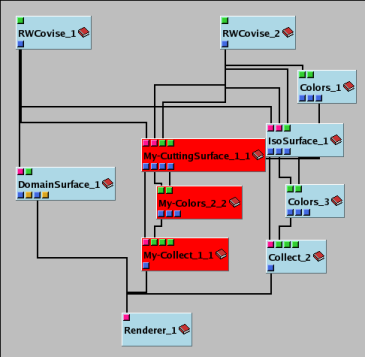
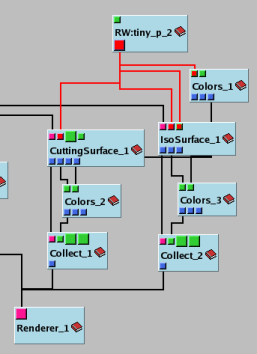
This canvas is used to show the module network. Module icons, that can be moves around, and connection lines between module ports can be seen. Executing a map visualizes the data using the Renderer window. The execution of modules is indicated by highlighting the icon boundaries of currently executing modules. This red highlighting sweeps sequential through the processing pipeline.
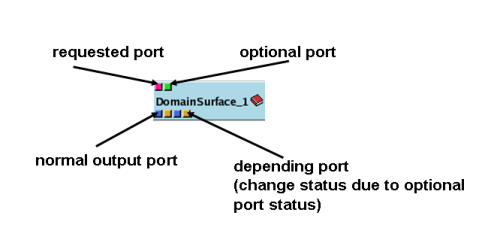
The above picture shows a typically module icon. Each module is represented by such an icon. A module icon has
These ports have to be connected. Otherwise an error message appears.
These ports can be optionally connected.
Normal output ports
These output ports depend on an input port. If such an output port is selected the corresponding input ports change its color and become required. If disconnected the corresponding input port become green again.
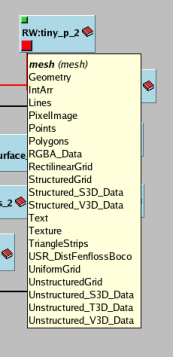
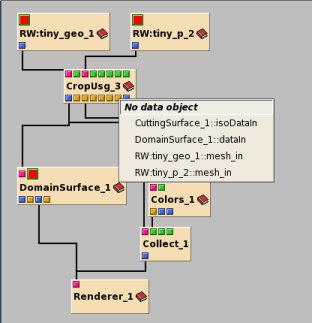
A tooltip shows port information like name, description and available datatypes. If a data object exists (after the pipline has already been executed) information about the created data type are shown, otherwise the text No data object appears.
A popup menu is shown, when the right mouse button is pressed on a module icon. This allows to perform the following module actions:
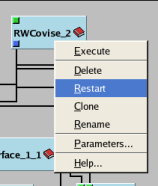
This executes the module network starting from the current module. It is typically more efficient to execute only a part of the map after having changed some parameters instead of executing the whole network. I/O modules often need a lot of time to read in large data files which is not necessary if a module parameter has been modified further down in the module chain.
The module is deleted and disappears from the canvas. This function is also avaibale to remove a module group.
Restarts the module with the current parameter values and connection lines.
In distributed and collaborative working mode the module is moved to an other host for execution. This means that the module is deleted on the current host and initialized on the other host. The current parameter and connections are moves too. This is only possible, if a further host was added.
An exact copy of the module with the current parameter values is created. Connection lines inside a copied module group are also picked.
In distributed and collaborative working mode the module is copied to another host for execution. This means that the module is initialized on the other host and remain on the original host. This is only possible, if an additional host was added.
The module is renamed. A new name is prompted for. This action is also avilable to add a label to a module group.
The Module Parameterwindow is opened. This action has the same effect as clicking on a module book icon.
A HTML module description is shown in the Qt Help viewer, that is part of the Map Editor.
Hold down the left mouse button on the module icon. The mouse pointer changes and you can move the icon to a new position. The icon will follow the mouse pointer. Then release the mouse button. If the icons have connection lines to other ports, these lines will be repositioned too.
YThere are two methods for grouping module icons on the canvas:
Press the SHIFT-Key and click on a module icon. The icon background changes to the user selected highlight color . Doing the same action on an already selected module icon deselects it.
Click on an empty part of the canvas to determine the startpoint of the rubberband rectangle. Keep the mouse button pressed and move the mouse so that module icons which should be grouped together lie completely inside the rectangle. After the mouse button is released each of the icons inside the group become red (the current hihglight color). Clicking on an empty part of the canvas ungroups the group.
To build a module network you must connect the output ports of modules to the input ports of follow-on modules. Input and output ports of modules are color coded buttons according to the Module Icon. A blue input port represents a data port, that has to be connected before a proper execution is possible. A green input port represents an optional port that can have a connection. Not all blue output ports need to be connected.
There are two methods for connecting ports:
The easiest way to establish proper connections without looking into the detailed descriptions of the module ports is by clicking with the left mouse button on the port of a module. This leads to highlighting and/or blowing up of matching module ports, which offer the appropriate data type.
Move the cursor to a heighlighted port. You now see a rubber line following your mouse cursor.
The connection is established when the mouse button is released within a port. You can also directly click onto the the desired highlighted port. In the same way you have to connect all modules of a map.
Pressing/clicking on a port with the right mouse button pops up a menu that shows matching ports. Selecting an item will create a connection line. This method is best when the network map has a lot a modules some of them outside the visible range.
Move the mouse over a connection line. The line will be highlighted if the cursor is exactly on the line. Delete the connection line by a double click or via a popupmenu that is shown when using the right mouse button on a line.
Every module can present a detailed view of its input and output data objects as well as its parameters. Click with the left mouse button on the book icon of a module. A new window appears on top of the MapEditor window (default) or a new dockable widget becomes visible inside the main Map Editor window. The positions depends on your Settings parameter.
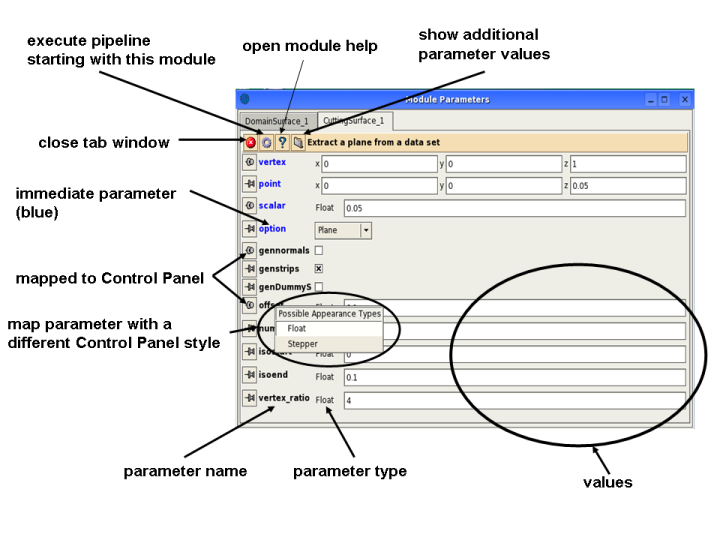
Each parameter is represented by
This toggle button is used to map an interactor to the Control Panel window. It contains also the name of the parameter. The type ( String, Boolean, Vector, Scalar, Slider, Choice, Browser) and the description is shown as tooltip. Most of the parameters were mapped with a standard appeareance that cannot be changed.
Different appearance types for the parameter can be used Scalar and Slider. It is always possible to change the type.
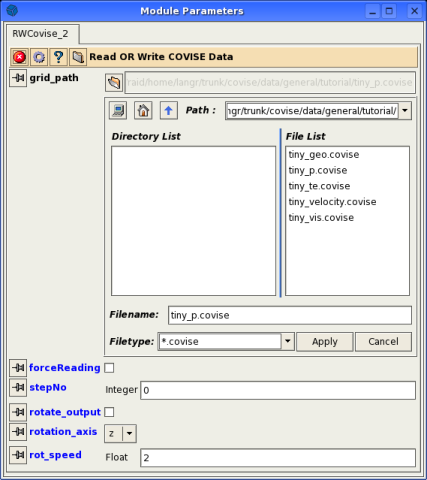
For the parameter type Brower and Colormap a folder icon is visible. Clicking on this icon opens an additional browser window either below the parameter list inside the Module Parameter window or in a seperate window. Clicking on the open file icon will close the browser window.
The value fields contain the parameter values. Depending on the parameter type different input fields to change the values are available. Values can be selectively overwritten . The following list will show the different represenation of the parameter types
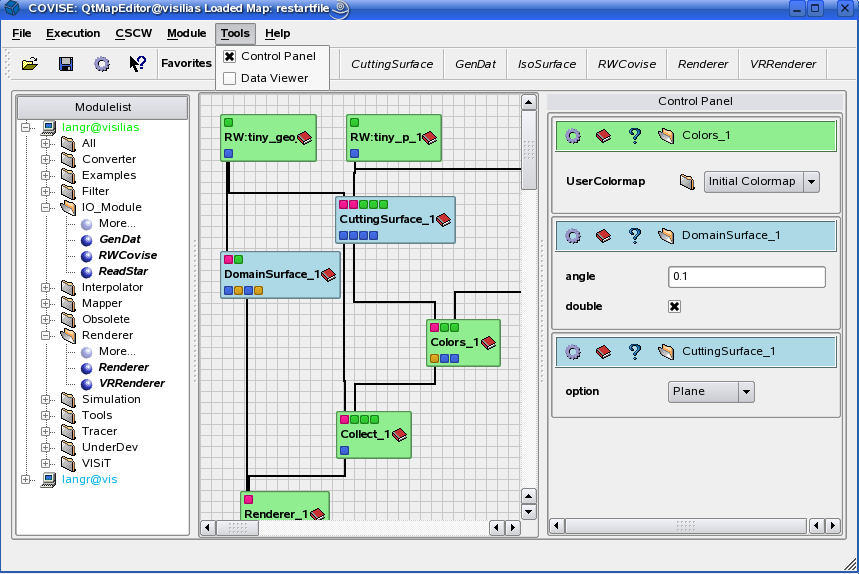
The purpose of the Control Panel is the collection of graphical interactors which typically represent often used and changed parameters.
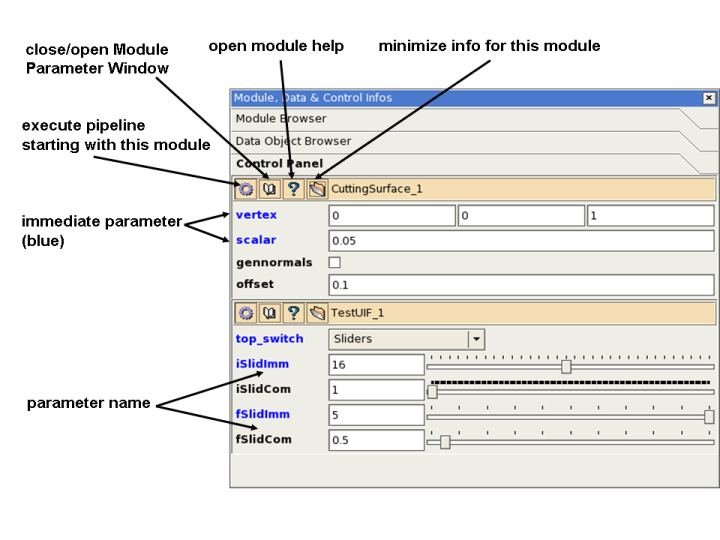
Widgets corresponding to the parameter types are used for the layout of interactor. Interactors in the ControlPanel allow the manipulation of parameters at every time without the need to pop up the Module Parameter. By clicking the toggle button in the Module Parameter window an interactor is generated. Its representation then appears in the Control Panel.
Changes made via interactors in the Control Panel are updated in the corresponding parameter value fields of the Module Parameter window. This works also vice versa.
Available interactors for each parameter are shown in the following list.
Data objects are created when a map is executed. The names of the data objects are generated generically, after the map was executed once. After a new execution the list is updated with the new names.
If you select a data object in the Data Object Browser more information is shown in the Data Viewer on the right side of the Map Editor
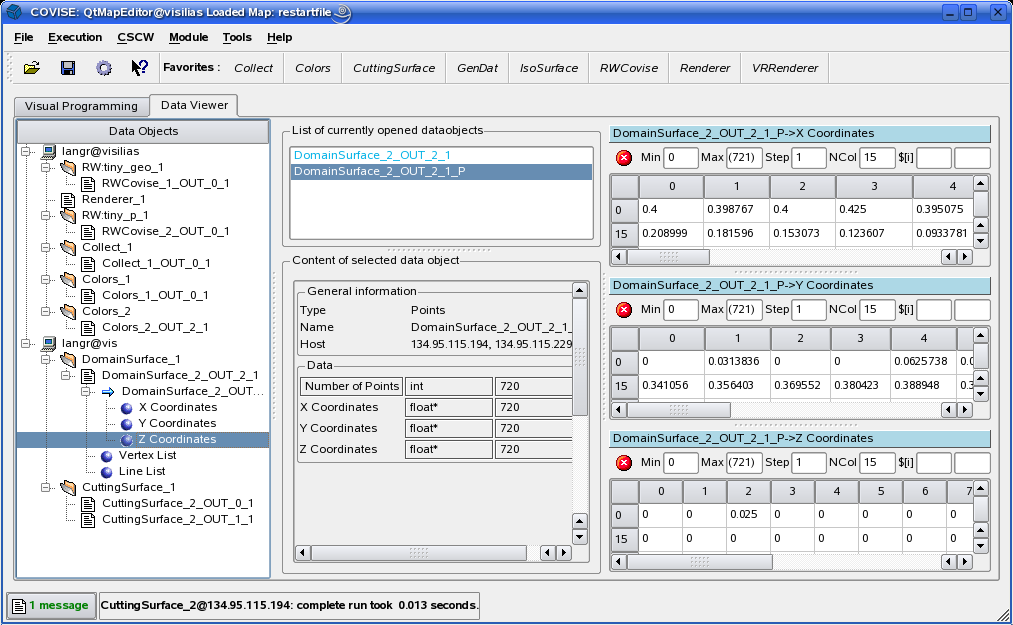
Be careful if the data field is large or the data is located on another host, because this action will be time consuming.
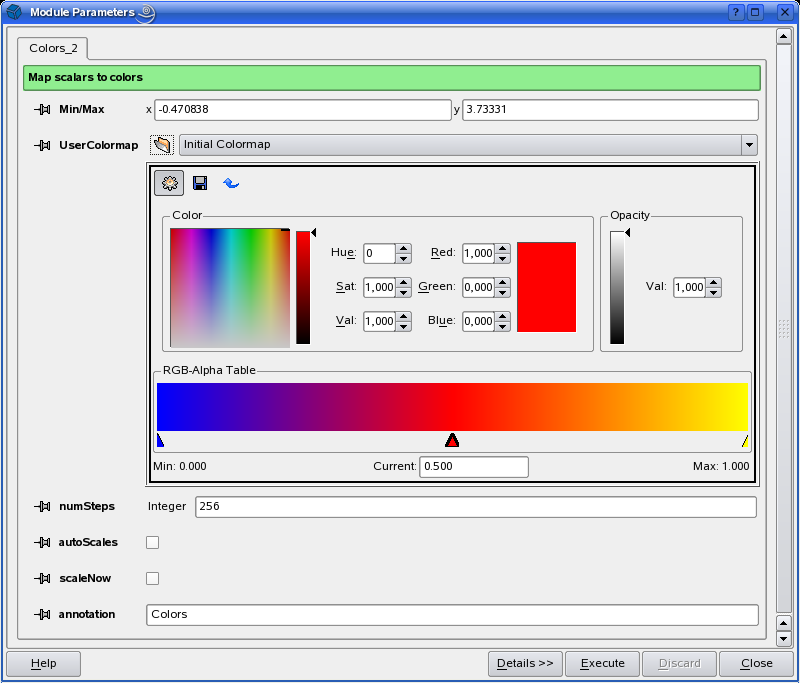
The purpose of the colormap editor is to define the “transfer function”, i. e. the mapping from scalar values to opacity (i. e. inverse transparency) and colour values. The range of your data is mapped to for the purpose of defining colour mappings.
The transfer function is given as a piecewise linear mapping, the small triangles (“interpolation markers”) below the coloured bar in the picture above serve as nodes for linear interpolation. By clicking on an interpolation marker you can select it for manipulation:
The opacity can be modified by the self-named slider and input fields. For changing the colour values, there are more possibilities:
For speeding up, chose from predefined colour maps available in the configuration file with the “Available Colormaps” combo box, use the button labelled “Save in ConfigFile” for adding such a colour map.
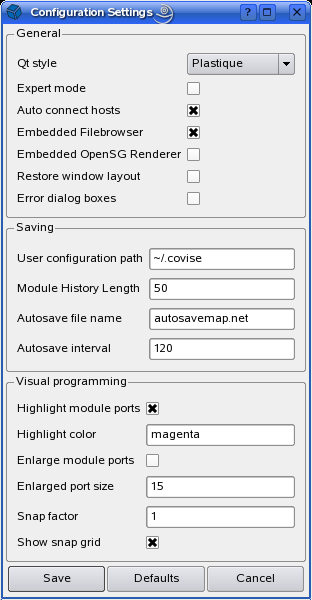
Settings are used for the appearance and behaviour of the Map Editor. These parameters are stored in the
file mapqt.xml which resides in $HOME/.covise and in $APPDATA\covise respectively.
defines the Qt theme used for the layout. These themes can differ from one operating system to the other. On Linux systems the default style is used.
If set all modules in the Module Browser are always shown.
Autoconnect hosts of a loaded network if this map contains additional hosts.
Opens the filebrowser for this module parameter inside the Module Parameter window.
Integrate the OpenSG renderer windows inside the Map Editor as a tab on the right side. Currently not implemented.
After quitting the Map Editor all positions and sizes of all windows are stored and reopened again the next time.
Off - show errors in the Message Area.
On - pops up a dialog error window.
Path for storing files.
Maximal numbesr of modules that will be stored.
After a certain amount of time a map is automatically stored using the above name.
After a certain amount of time (120 sec) a map is automatically stored.
When connecting ports in the Visual Programming Area highlight matching ports.
Color name (from rgb.txt) for highlighting ports, connection lines and module icons.
When connecting ports in the Visual Programming Area blow up module ports for better visibility .
Hight of enlarged module ports in pixel.
When moving module icons in the Visual Programming Area the move of corresponding connection lines were shown (time comsuming)
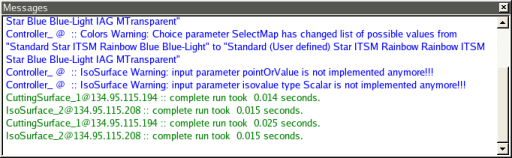
This scrollable text output window shows messages with different colors
Messages are sent from modules during their execution, the Controller and the request broker CRB.
This editable text field is used for sending information to other partners joining a COVISE session. As expected, the chat line is shown for two or more partners only.